The other day I wrote a comment in which I tried to project future voting trends in Texas. This diary is a lot like that comment! But with more words. And a few images.
First, a little bit of background on Texas demographics. As of the 2010 census, the state was about 45% white, 38% hispanic, 11% black, and 6% other, mostly Asian. That's compared to 53/32/11/4 in 2000. State's getting less white, more hispanic. But you knew that.
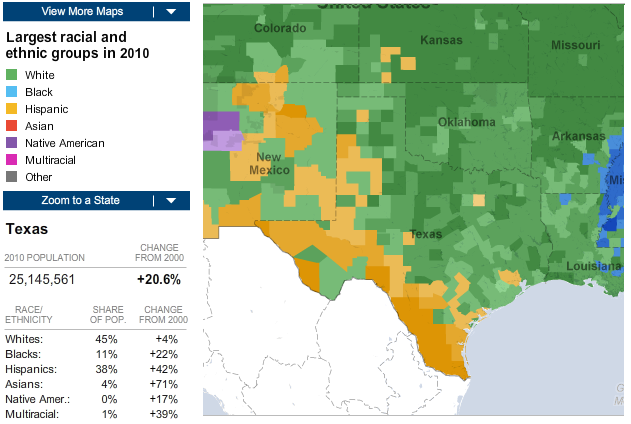
(Map is from the NY Times.) People look at such numbers sometimes and say Whaaaaa?? How are Democrats not competitive in Texas with numbers like that? That's f'ed up, dog! Well, there are a couple of reasons. For one thing, about 10-15% of the Hispanic population are non-citizens. Here's where the undocumented population lives, in case you're curious:
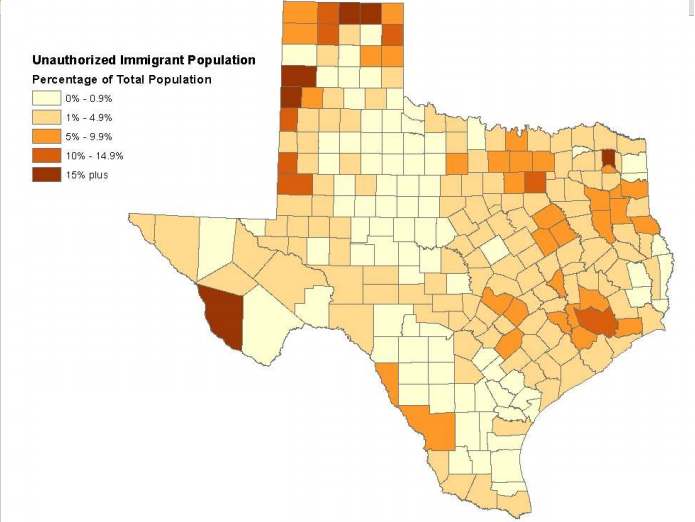
(This and the next image are from a presentation (pdf) by the state demographer.) You'll notice that most undocumented immigrants live in the Houston and Dallas metros, whereas the vast majority of hispanics that live in the border counties are citizens. This goes a long way towards explaining, incidentally, why hispanic turnout always seems so feeble in Texas' two biggest cities.
All right, so there's that. But an even more important factor is the age structure of the state:
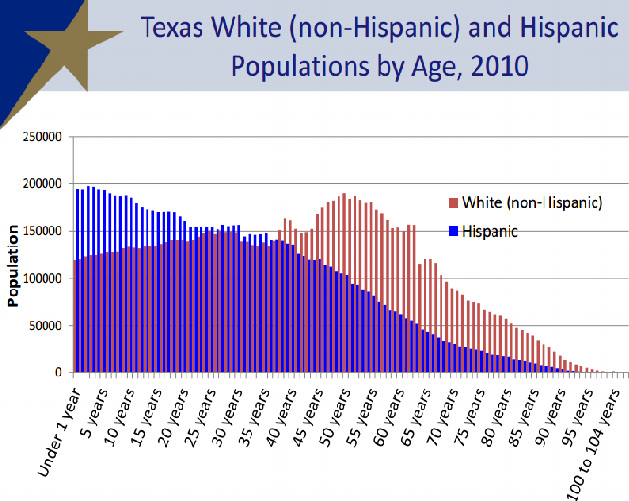
Setting aside the citizenship issue, the hispanic population skews very young - a lot of them are just too young to vote. (Plus the ones who are eligible are less likely to vote, just because young people are more likely to stay home on election day. Whereas old folks like nothing more than to vote. Man, they just vote, vote, vote! Vote like there's no tomorrow (which there isn't for old folks, of course). And just look how white old folks in Texas are!) All of which is to say, the citizen voting age population substantially lags the demographic change which Texas has seen in recent years.
* * *
Okay, so. Here is a study from the William C. Velazquez Institute that looks at the demographic future of the US, California, and Texas, including predictions of citizen voting age population by demographic group. And here's a graph they made for Texas:
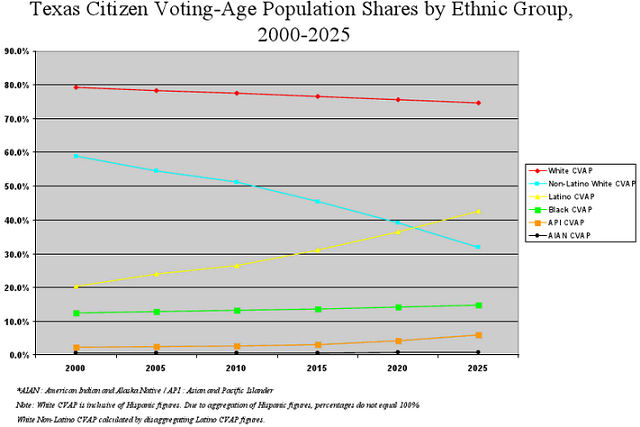
CVAP-wise, here are the percentages they give for whites/hispanics/blacks/others by year:
2010: 57/26/13/4
2015: 51/31/14/4
2020: 45/36/14/5
2025: 35/44/14/7
(The numbers for whites are inferred, because hispanics overlap with whites somewhat in the census data WCVI is using - that's why numbers for whites are higher here than they are in the graph above.)
You can see the discrepancy from overall population figures - a white/hispanic ratio of 45/38 in the overall population becomes 57/26 in terms of CVAP. But the question I want to answer is: what do these numbers say about future voting patterns in Texas?
Well, in 2008, Obama won 26% of whites, 63% of hispanics, 98% of blacks, and, let's say, 60% of others (just guessing on that one). In 2010 as a gubernatorial candidate, Bill White got 29% of whites, 61% of hispanics, 88% of blacks, and who knows how many of the others. So if we're looking at expected performance for a fairly generic democratic candidate for federal office in Texas in a neutral year, I think we can expect they'd get about 27% of whites, 62% of hispanics, 90% of blacks, and that made up number of 60% for others.
So if we plug in those numbers to the demographic profile, this is the percentage of the two-party vote the Democrat would get:
2010: 45.6
2015: 48.0
2020: 50.1
2025: 53.5
This makes it seem that Dems ought to be competitive in Texas statewide races by the end of this decade, and solidly favored by the mid-'20s. However, this forecast would basically represent turnout nirvana for Democrats, because hispanics do not vote at anywhere near their CVAP numbers.
(As an aside - this is generally treated as a problem of "getting out the hispanic vote." But I wonder about this. The hispanic population is disproportionately young and poor, and if you corrected for these two variables, I wonder if there would be any depressed turnout effect attributable simply to hispanic identity. Someone should look into this!)
Anyways, to illustrate the point: according to this report, the CVAP breakdown in Texas ca. 2008 was about 58/26/13/3, but according to exit polls turnout was 63/20/13/4. Given the numbers I used above, that works out to 43.5% for the Dem - just slightly less than Obama's actual share, since he of course totally dominated the black vote.
So what would be more realistic turnout projections? Maybe something like this:
2010: 64/19/13/4
2015: 58/24/14/4
2020: 52/29/14/5
2025: 42/37/14/7
Here I just added 7% to the white vote share and subtracted the same amount from the hispanic vote share. Pretty crude, but it's consistent with continuing underperformance for hispanic turnout, yet slowly improving hispanic turnout relative to population share. (Also I should mention that these are predictions for turnout in presidential elections, though obviously 2020 is the only year that will actually have such an election.) So what do these numbers yield given the same assumptions given above about Dem performance among each group? The following:
2010: 43.2
2015: 45.5
2020: 47.6
2025: 51.1
So if we assume Dem performance remains static among each demographic group for the next 12 years, Texas ought to be a genuine swing state by the 2024 election. We might even have a shot in Texas by 2020, depending on how that year plays out.
But I wonder about these numbers a bit. In particular, I'm surprised at the rate at which the CVAP in these projections approaches overall population numbers. As I mentioned above, in 2010 Texas was 45% white, 38% hispanic, 11% black, and 5% other, meaning the white CVAP was 12 points higher than overall population, but for 2025 the population breakdown should be about 34/48/11/7, implying a white CVAP only 1 point higher than total population. That don't make no sense! (Or at least, it seems unlikely to me.)
I'm thinking, then, it would be prudent to bump up the white numbers for expected turnout by a bit - say, +2 for 2015, +4 for 2020, and +6 for 2025, and subtract the same for hispanics. Then we get turnout that looks like this:
2010: 64/19/13/4
2015: 60/22/14/4
2020: 56/25/14/5
2025: 48/31/14/7
Which yields Dem vote shares of:
2010: 43.2
2015: 44.8
2020: 46.2
2025: 49.0
Okay, there you go. If this diary is offering a prediction, this is it. And what this prediction says is that Texas ought to be on the cusp of competitiveness by 2024 - and, though the numbers don't go this far out, it's clear that the state ought to have a gen-u-ine Dem+ PVI by 2028. A slight one, but still.
And if you're wondering if there are precedents for this sort of demographics-based partisan shift - I think there are. California and Nevada have been undergoing many of the same demographic trends as Texas: rapidly growing minority populations, especially hispanics, etc. These states just may be a bit farther ahead on the curve (and of course they started from a much higher Democratic base). And here are what the Democratic margins have been in California relative to the national vote over the last four elections (1996-2008): +4.4, +11.3, +12.4, +16.8; for Nevada the numbers are -7.5, -4.1, -0.1, +5.2. Whereas I'm predicting that between the elections of 2012-2024, Texas could go from roughly -12.4 to -9.8 to -7.6 to -3.1. As you can see, the changes in voting tendencies that have actually occurred in California and Nevada are greater than what I'm predicting for Texas. It can and does happen!
* * *
And, since I haven't yet procrastinated enough from what I should be doing right now, here's one more thing to consider: there is, of course, no reason to assume that party performance won't change at all among these different demographic groups over the next 15 years. Shoot, that's enough time to form totally new party coalitions. So these assumptions about party performance are hardly set in stone. Nonetheless, if we were going to predict a way party performance might change, we could look at how in-migration is changing the character of the Texas electorate. Non-whites are already factored in, since hispanics, blacks, etc. who move to Texas figure to vote about the same as those who already live there. On the other hand, along with all the junk in their U-Hauls, white migrants to the Lone Star state might bring along some new voting patters as well. And these are not trivial numbers of people:
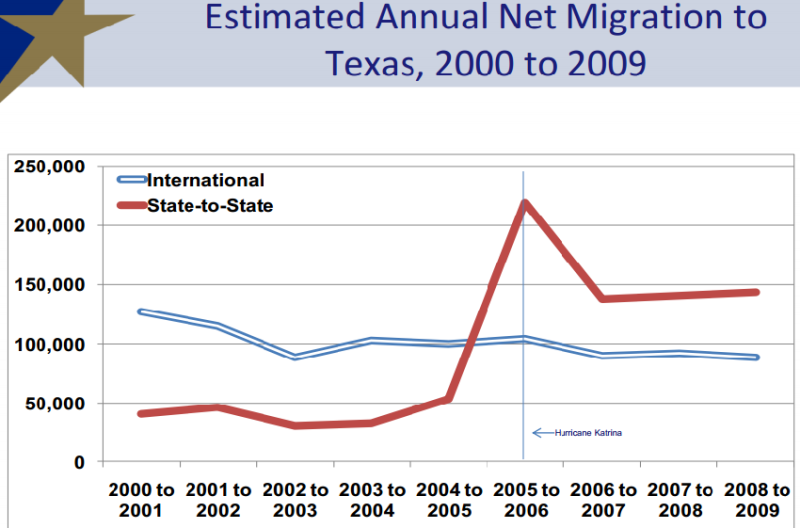
The trends you see here have continued into this decade. And the number one source of these migrants is California, followed by states like Arizona and Florida, as well as the big cities of the northeast and midwest. These are places where white voters vote more like 40-50% for Dems.
Now, I actually think (contrary to some) that Democrats may have a bit farther to fall with rural whites, at least in east Texas. But let's say they gain that back and a little more with the more moderate leanings of new migrants, so that the Dem share of the white vote goes up about a point every three years. (This might be optimistic, but whatever - I'm ending on a high note.) That would give us the following Dem performance:
2010: 43.2
2015: 45.9
2020: 48.1
2025: 51.4
Boom. Over 50% by the 2024 election. There you go.
Okay, I'm done. Jesus, that took for goddamn ever. I'm never writing a diary again.
Update: Just came across a post that looks at hispanic CVAP for each of the top 35 cities in Texas. It affirms what I said toward the beginning of this diary: very low CVAPs in Houston and DFW, considerably higher numbers elsewhere. Bonus observation from Greg:
Interesting differences among the major cities, to be sure. What’s even more interesting is applying a bit of algebra to the numbers provided, which show that Houston’s <18 population is 87.3% citizen [compared to 47.3% of the 18+ population). The trend is replicated throughout the state, with the statewide number for all cities being 92% for <18 Hispanics.
What this means is that the present hispanic population is something of a paper tiger in voting terms (as I've emphasized here) but that future growth in hispanic population most certainly will not be.
POST-2012 UPDATE: In 2008, whites were 63% of the electorate and went 73-26 for McCain. Blacks were 13% and went 98-2 for Obama. Hispanics were 20% and went 63-35 for Obama.
But Obama clearly did better with hispanics this year - almost every overwhelmingly hispanic county swung towards him, even though he did worse overall in the state.
And Lisa Falkenberg said this:
In Texas, the best data so far show a 70-30 split for Obama among Hispanic voters, according to Rice University political science chairman Mark Jones. Romney performed several points worse than Sen. John McCain did in 2008. At the same time, Jones points out, Hispanics became a larger share of the vote in Texas, going from 20 percent in 2008 to 25 percent in 2012.
That's a big bump. So if this is right, what percentage of whites did Obama win? Well, Romney won the two-party vote 58-42. So if the electorate was 25% hispanic (70-30 Obama), 13% black (95-5 Obama), 3% other (60-40 Obama), then whites would be 59% and they would have voted...
82-18 for Romney.
Yikes. That's pretty ugly.
But Falkenberg's claim that the electorate was 25% hispanic seems a bit high to me, especially given that turnout was generally down in the state. Based on the numbers above, I would have expected hispanics to be about 21-22% of the electorate this year. If they were 22% and going 70-30 for Obama, then Obama would have won more like 20% of the white vote. That's still lower than any other recent Dem presidential or senate candidate has done, but still seems believable to me.
Assuming a future composition of the Texas electorate of 56/25/14/5 W/H/B/O for 2020 and like 50/30/14/6 for 2024, then if 70-30 for hispanics and 20-80 for whites becomes the "new normal" in Texas, the republican would win 56-44 in 2020 and 53-47 in 2024.
In 2028 the state would be a toss-up.
Meanwhile, The state is out with population projections through 2050. They offer three migration scenarios; taking the middle one, and filtering for the over-18 population, here are white/hispanic/black/other percentages (2010 is based on the census):
2010: 50/34/11/5
2015: 47/36/11/6
2020: 44/38/11/6
2025: 41/41/11/7
2030: 39/43/11/7
2035: 36/45/11/8
...well, you get the idea. The CVAP numbers will of course be lower for hispanics and others, and higher for whites and blacks, but the gaps between VAP and CVAP will probably gradually narrow over time, as young hispanics are far more likely to be citizens.
Alternatively, if immigration remains as high as it was from 2000-2010, you get:
2010: 50/34/11/5
2015: 46/36/11/6
2020: 42/39/11/7
2025: 38/42/11/8
2030: 35/45/11/9
2035: 32/47/11/10
Though in this scenario I would imagine the gap between VAP and CVAP wouldn't narrow so much. At any rate, though the hispanic population will pass the anglo population around 2017 or 2018, that probably won't happen for the 18+ population until about 6-7 years later, and later still for CVAP (and later still than that for actual turnout, of course)
